This guide delves into the fascinating world of correlation analysis, using the CORREL function as a key tool. Understanding correlation is crucial in various fields, from finance to healthcare, enabling us to identify relationships between variables and make informed decisions. This comprehensive resource will cover everything from basic concepts to advanced applications, equipping you with the knowledge to effectively analyze data and uncover hidden patterns.
We will explore the significance of correlation, examining different types and their visual representations. Further, the guide will provide a step-by-step approach to using the CORREL function in popular spreadsheet software, along with practical examples to illustrate its application. Data preparation, visualization techniques, and the interpretation of correlation coefficients will also be thoroughly discussed.
Introduction to Correlation
Correlation measures the statistical relationship between two variables. It quantifies how strongly those variables tend to change together. Understanding correlation is crucial in many fields, from social sciences to finance, enabling us to identify patterns, make predictions, and ultimately, make more informed decisions. For instance, economists use correlation to analyze the relationship between interest rates and inflation, while sociologists use it to understand the correlation between socioeconomic status and health outcomes.Correlation analysis plays a vital role in data analysis.
By determining the strength and direction of a relationship, researchers and analysts can gain insights into complex phenomena and develop effective strategies for addressing issues or optimizing outcomes. For example, businesses use correlation to identify factors that impact sales, enabling them to tailor their marketing and production strategies more effectively.
Types of Correlation
Correlation can be positive, negative, or nonexistent (no correlation). Positive correlation indicates that as one variable increases, the other tends to increase as well. Conversely, negative correlation signifies that as one variable increases, the other tends to decrease. A lack of correlation implies that the variables are not systematically related. Examples are crucial for illustrating these concepts.
| Type | Description | Example Data | Visual Representation (brief description) |
|---|---|---|---|
| Positive Correlation | As one variable increases, the other tends to increase. | Hours studied (x) and Exam score (y): (10, 85), (15, 92), (20, 98) | A scatter plot with points trending upwards from left to right. |
| Negative Correlation | As one variable increases, the other tends to decrease. | Temperature (x) and Ice cream sales (y): (25, 100), (30, 80), (35, 60) | A scatter plot with points trending downwards from left to right. |
| No Correlation | No discernible relationship between the variables. | Height (x) and shoe size (y) for adults: (170, 9), (180, 10), (165, 8) | A scatter plot with points scattered randomly without a clear upward or downward trend. |
Importance of Understanding Correlation
Understanding correlation is essential for sound data analysis and decision-making. It allows analysts to identify meaningful relationships within data sets, enabling more accurate predictions and informed conclusions. For example, a positive correlation between advertising expenditure and sales revenue might suggest that increasing advertising can boost sales. Likewise, a negative correlation between employee turnover and training investment could imply that investing in employee training can reduce turnover.
Therefore, the ability to recognize and interpret correlations is vital in a wide range of professional fields.
Understanding the CORREL Function
The CORREL function, a cornerstone of spreadsheet and statistical software, is a powerful tool for evaluating the linear relationship between two data sets. It quantifies the strength and direction of this association, providing valuable insights into the potential correlation between variables. Understanding its purpose, syntax, and application is crucial for effective data analysis.
Purpose of the CORREL Function
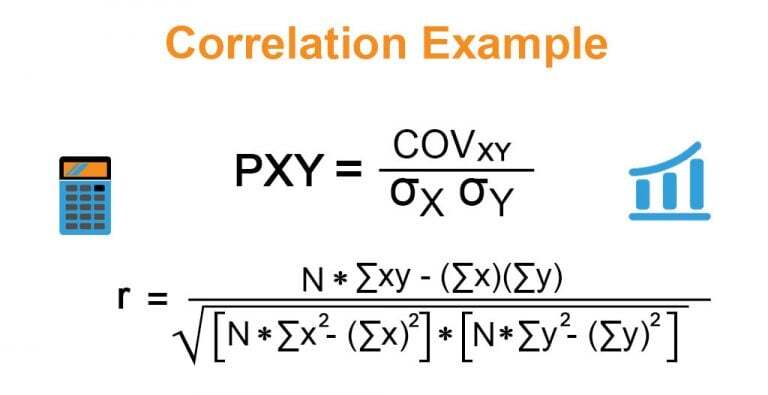
The CORREL function calculates the Pearson correlation coefficient between two data sets. This coefficient, ranging from -1 to +1, indicates the strength and direction of the linear relationship. A coefficient of +1 signifies a perfect positive correlation, -1 a perfect negative correlation, and 0 indicates no linear correlation. This allows analysts to determine if variables tend to increase or decrease together, or if there’s no discernible pattern.
Syntax of the CORREL Function
The CORREL function in most spreadsheet programs and statistical software takes two arguments:
`=CORREL(array1, array2)`
Where:* `array1`: Represents the first data set.
`array2`
Represents the second data set.Both `array1` and `array2` must be numerical data. They should contain the same number of data points for accurate calculation. The function measures how well these two data sets are linearly related to each other.
Examples of CORREL Function Usage
Consider these scenarios:* Analyzing Sales Data: A business wants to see if there’s a relationship between advertising spending and sales revenue. They input the advertising costs (array1) and corresponding sales figures (array2) into the CORREL function. A positive correlation would suggest that increased advertising leads to increased sales.* Evaluating Student Performance: A teacher wants to see if there’s a relationship between hours of study and exam scores.
The hours studied (array1) and exam scores (array2) are entered into the function. A positive correlation would indicate that more study time is associated with higher scores.* Financial Modeling: An investor wants to determine if the price of two stocks move in a similar way. The closing prices of the two stocks (array1 and array2) are used in the CORREL function.
A positive correlation suggests that the stocks tend to move together.
Detailed Explanation of Arguments
| Argument Name | Description | Data Type | Example Input |
|---|---|---|---|
| array1 | The first array of numerical data. | Numerical | 10, 12, 15, 18, 20 |
| array2 | The second array of numerical data, with the same number of elements as array1. | Numerical | 25, 28, 30, 32, 35 |
The function returns a numerical value between -1 and +1, representing the correlation coefficient. A value closer to +1 or -1 indicates a stronger linear relationship.
Data Preparation for Correlation Analysis

Accurate correlation analysis hinges on the quality of the input data. Raw data often requires careful cleaning and transformation to ensure meaningful results. This process, known as data preparation, is crucial for avoiding misleading conclusions and producing reliable insights. Ignoring data quality issues can lead to inaccurate interpretations of relationships between variables.
Importance of Data Quality
High-quality data is essential for obtaining reliable correlation results. Inaccurate or inconsistent data can obscure true relationships and produce misleading correlations. Data errors, such as typos, incorrect units, or inconsistent scales, can distort the correlation coefficient and lead to flawed interpretations. Data quality issues are not always immediately apparent, necessitating a rigorous data preparation process.
Handling Missing Values
Missing values are a common problem in datasets. These missing values can significantly impact correlation analysis if not addressed appropriately. Several strategies exist for handling missing values. One approach is to remove observations with missing values. However, this can lead to a loss of data and potentially bias the results if the missing data is not randomly distributed.
Another strategy is to impute missing values, filling them with estimated values based on the existing data. Common imputation methods include mean imputation, median imputation, and more sophisticated techniques such as regression imputation. The choice of method depends on the nature of the missing data and the specific dataset.
Handling Outliers
Outliers are data points that deviate significantly from the rest of the data. These outliers can significantly influence the correlation coefficient, potentially leading to a spurious correlation. Identifying and addressing outliers is essential for accurate correlation analysis. Outliers can be identified using various statistical methods, such as box plots or scatter plots. Once identified, they can be handled in several ways.
These include removal, transformation, or assigning them a special value (e.g., a missing value indicator). Care must be taken in outlier handling to avoid introducing bias into the analysis.
Data Transformations
Data transformations are often necessary to improve the linearity and distribution of the data. Logarithmic, square root, or other transformations can make variables more suitable for correlation analysis. These transformations can help in situations where the variables exhibit non-linear relationships or have skewed distributions. Applying transformations appropriately can improve the accuracy and reliability of correlation results.
| Transformation Type | Description | Effect on Correlation | Example Dataset |
|---|---|---|---|
| Logarithmic | Applies the logarithm to each data point. | Can improve linearity and reduce the influence of outliers in skewed data. | Sales figures over time, where growth is exponential. |
| Square Root | Applies the square root to each data point. | Can improve linearity and reduce the influence of outliers in data with a high degree of variance. | Population sizes of different cities. |
| Reciprocal | Calculates the reciprocal (1/x) of each data point. | Can transform data with exponential decay into a linear format. | Data showing the decay of a substance over time. |
| Box-Cox | A family of transformations that determines the optimal transformation based on the data. | Can improve normality and linearity. | Data with various distributions and relationships. |
Step-by-Step Data Cleaning and Preparation Procedure
- Data Inspection: Examine the data for missing values, outliers, and potential inconsistencies. Utilize descriptive statistics and visualizations (e.g., histograms, box plots) to identify potential issues.
- Handling Missing Values: Choose an appropriate method for handling missing values. Imputation or removal are common approaches. Document the chosen method.
- Outlier Treatment: Identify outliers and decide on the appropriate action (removal, transformation, or special value assignment). Justify the chosen approach.
- Data Transformation: If necessary, apply logarithmic, square root, or other transformations to improve data linearity and distribution. Verify the effect of transformations on the correlation coefficient.
- Data Validation: Review the cleaned and transformed data to ensure accuracy and consistency. Document all steps and justifications.
Calculating Correlation Coefficients
Calculating correlation coefficients is a crucial step in understanding the relationship between two variables. A correlation coefficient quantifies the strength and direction of a linear association. This section will detail how to calculate these coefficients using spreadsheet software, provide examples, and explain their interpretation.
Using the CORREL Function in Spreadsheet Software
Spreadsheet software like Microsoft Excel and Google Sheets provide a built-in function, CORREL, to easily calculate correlation coefficients. This function takes two arrays of data as input, representing the two variables being analyzed. The function returns a numerical value representing the correlation coefficient.
Examples of Calculating Correlation
Let’s consider two datasets:
- Dataset 1 (Sales vs. Advertising):
- Advertising spending (in thousands of dollars): 10, 15, 20, 25, 30
- Sales (in thousands of dollars): 12, 18, 22, 28, 32
- Dataset 2 (Temperature vs. Ice Cream Sales):
- Temperature (in degrees Celsius): 20, 22, 25, 28, 30
- Ice Cream Sales (in units): 100, 120, 150, 180, 200
Using the CORREL function in Excel or Google Sheets on these datasets will yield correlation coefficients. The result for Dataset 1 will be close to 0.95, indicating a strong positive correlation between advertising and sales. The result for Dataset 2 will be close to 0.99, showing a very strong positive correlation between temperature and ice cream sales. These results suggest that as advertising spending increases, sales tend to increase as well; and as temperature rises, ice cream sales also tend to increase.
Comparing and Contrasting Correlation Coefficient Methods
The CORREL function calculates the Pearson correlation coefficient. This method is appropriate for linear relationships. Other methods, such as Spearman’s rank correlation, may be suitable for non-linear relationships. The choice of method depends on the nature of the data and the type of relationship being examined.
Interpretation of Correlation Coefficients
Correlation coefficients range from -1 to 1. A value of 1 indicates a perfect positive correlation, meaning that as one variable increases, the other increases proportionally. A value of -1 indicates a perfect negative correlation, where as one variable increases, the other decreases proportionally. A value of 0 indicates no linear correlation.
Correlation coefficients provide insight into the strength and direction of a relationship between two variables. A coefficient of 0.8 signifies a strong positive correlation; 0.3, a weak positive correlation; -0.7, a strong negative correlation; and -0.1, a weak negative correlation.
Correlation analysis is a powerful tool for understanding relationships between variables, and the CORREL function simplifies the process in spreadsheet software.
Visualizing Correlation
 | How to Use Correlation in Excel?")
Visualizing data is crucial for understanding relationships between variables. Scatter plots provide a powerful tool for illustrating the correlation between two quantitative variables. They effectively display the pattern of data points and enable a quick assessment of the strength and direction of the correlation. This visual representation often reveals insights that might be missed when examining numerical correlation coefficients alone.Scatter plots are a graphical representation of the relationship between two variables.
Each point on the plot corresponds to a pair of values from the dataset, with one variable plotted on the horizontal axis and the other on the vertical axis. The pattern of the plotted points reveals the nature of the correlation.
Creating Scatter Plots
Scatter plots are essential for visualizing the correlation between two variables. They effectively depict the relationship by plotting data points on a graph. This visual representation allows for a quick assessment of the strength and direction of the correlation. The arrangement of points on the graph reveals the nature of the correlation.Creating scatter plots in spreadsheet software is straightforward.
Typically, one variable is selected for the horizontal axis, and the other for the vertical axis. Spreadsheet software often provides options to customize the plot, including adjusting the axis scales, adding labels, and choosing different markers for the data points.
Interpreting Scatter Plots
A scatter plot visually displays the correlation between two variables. By observing the distribution of data points, one can infer the strength and direction of the correlation. The closer the points cluster around a line, the stronger the correlation. The direction of the line, whether upward or downward, indicates the type of correlation. A strong positive correlation is indicated by points clustered around an upward-sloping line, while a strong negative correlation is represented by points clustered around a downward-sloping line.
Scatter Plots and Correlation Coefficients
The scatter plot’s visual representation directly relates to the correlation coefficient. A strong linear relationship, visualized by points closely clustered around a line, results in a correlation coefficient close to +1 or -1. Conversely, a weak linear relationship, where points are scattered widely, corresponds to a correlation coefficient closer to 0. The direction of the line on the scatter plot mirrors the sign of the correlation coefficient (positive for upward trends, negative for downward trends).
Spreadsheet Software Guide
Spreadsheet software, like Microsoft Excel or Google Sheets, provides a user-friendly interface for creating scatter plots. Typically, the process involves selecting the data, choosing the “scatter” chart type, and then customizing the chart’s elements like axis labels, titles, and data markers. Specific steps might vary slightly depending on the software used.Below is a table illustrating the relationship between correlation type, scatter plot appearance, and example plot description:
| Correlation Type | Scatter Plot Appearance | Example Plot (brief description) |
|---|---|---|
| Strong Positive | Points closely clustered around an upward-sloping line | Points tightly grouped, trending upward from left to right. |
| Weak Positive | Points loosely scattered around an upward-sloping line | Points are more spread out but still trend upward. |
| Strong Negative | Points closely clustered around a downward-sloping line | Points tightly grouped, trending downward from left to right. |
| Weak Negative | Points loosely scattered around a downward-sloping line | Points are more spread out but still trend downward. |
| No Correlation | Points scattered randomly with no discernible pattern | Points show no clear upward or downward trend. |
Practical Applications of Correlation Analysis
Correlation analysis is a powerful tool for understanding the relationships between variables. Its applications extend across diverse fields, from finance and marketing to healthcare and beyond. By quantifying the strength and direction of these relationships, correlation analysis provides valuable insights for decision-making, helping organizations and individuals make more informed choices.Understanding the degree of association between variables is crucial for predicting future outcomes and optimizing strategies.
Correlation analysis plays a pivotal role in uncovering these relationships and facilitating informed decision-making processes.
Real-World Applications in Various Fields
Correlation analysis is widely used in diverse fields due to its ability to reveal the strength and direction of relationships between variables. This understanding is crucial for informed decision-making.
- In finance, correlation analysis helps assess the risk associated with portfolios of investments. For example, if the returns of two stocks are highly correlated, a portfolio containing both stocks may exhibit similar fluctuations, potentially leading to a less diversified portfolio. By understanding the correlation, investors can construct more diversified portfolios that mitigate risk.
- In marketing, correlation analysis helps identify factors influencing consumer behavior. For instance, a study might investigate the correlation between advertising spending and sales figures. A strong positive correlation suggests a positive impact of advertising on sales, potentially guiding marketing strategies and resource allocation.
- In healthcare, correlation analysis can be used to study the relationship between lifestyle factors and health outcomes. For example, researchers might investigate the correlation between smoking habits and the incidence of lung cancer. Such analysis can help identify risk factors and develop preventative strategies.
Decision-Making with Correlation Analysis
Correlation analysis provides crucial insights for informed decision-making. By quantifying the strength and direction of relationships, it allows stakeholders to make more strategic choices.
- Financial institutions use correlation analysis to evaluate the risk of a portfolio of investments. A high positive correlation between the returns of different investments indicates a lack of diversification, potentially increasing overall portfolio risk. Conversely, a low correlation suggests a more diversified portfolio, mitigating risk.
- Marketing teams leverage correlation analysis to optimize their campaigns. A strong positive correlation between social media engagement and sales figures suggests that social media efforts are effective in driving sales. This insight allows for informed allocation of resources to maximize campaign impact.
- Healthcare professionals use correlation analysis to identify risk factors for diseases. A strong positive correlation between exposure to a particular pollutant and the incidence of a respiratory illness suggests a potential causal link, which can guide public health initiatives.
Comparison with Other Statistical Methods
Correlation analysis, while valuable, has limitations compared to other statistical methods. It does not imply causation; a strong correlation does not necessarily mean one variable causes the other. Further analysis, such as regression analysis, is often required to establish causal relationships.
Table of Applications
| Field | Example Application | Correlation Analysis Role | Possible Outcomes |
|---|---|---|---|
| Finance | Analyzing the correlation between stock prices of different companies | Identifying potential diversification opportunities or risks in investment portfolios. | Identifying highly correlated stocks, suggesting a less diversified portfolio, or identifying uncorrelated stocks, indicating a potentially more diversified portfolio. |
| Marketing | Examining the correlation between customer demographics and purchase behavior. | Understanding consumer preferences and tailoring marketing strategies. | Identifying specific demographics associated with higher purchasing frequency or specific product preferences, allowing for targeted marketing campaigns. |
| Healthcare | Investigating the correlation between diet and blood pressure levels. | Identifying potential risk factors for high blood pressure and guiding dietary recommendations. | Identifying correlations between specific dietary components and blood pressure levels, suggesting dietary modifications for improved health outcomes. |
Limitations of Correlation Analysis
Correlation analysis is a valuable tool for understanding relationships between variables. However, it’s crucial to recognize its limitations to avoid misinterpretations and drawing incorrect conclusions. Correlation does not automatically imply causation, and other factors can influence observed relationships. A thorough understanding of these limitations is essential for accurate interpretation and application of the results.
Correlation Does Not Imply Causation
Correlation analysis identifies the strength and direction of a relationship between two variables. However, a strong correlation does not necessarily mean that one variable causes the other. A third, unmeasured variable could be influencing both variables, creating a spurious correlation. For example, ice cream sales and crime rates might be positively correlated, but this does not mean that increased ice cream sales cause an increase in crime.
A third factor, such as higher temperatures, could be driving both phenomena.
Importance of Considering Other Factors
Interpreting correlation results requires careful consideration of other potential contributing factors. Correlation analysis should not be used in isolation. It’s important to examine the context of the data, consider the plausibility of causal relationships, and explore alternative explanations. Analysts should seek to understand the underlying mechanisms that may be driving the observed correlation. For instance, a study showing a correlation between hours of exercise and weight loss should also consider factors like diet, genetics, and overall lifestyle.
Ignoring these factors could lead to misleading conclusions.
Potential Pitfalls and Caveats
| Pitfall | Explanation | Mitigation Strategy |
|---|---|---|
| Ignoring Confounding Variables | A third variable, not accounted for in the analysis, may be influencing the relationship between the two variables of interest. | Employ statistical techniques such as controlling for confounding variables in the analysis. Include additional variables in the model to account for their influence. Consider experimental designs if possible to minimize the impact of extraneous factors. |
| Limited Sample Size | A small sample size can lead to inaccurate estimations of the correlation coefficient, making it unreliable for generalization to a larger population. | Ensure a sufficiently large sample size to obtain statistically significant results. Consider alternative statistical methods, such as bootstrapping, to assess the stability of the correlation coefficient across different samples. |
| Non-linear Relationships | Correlation analysis assumes a linear relationship between variables. If the relationship is non-linear, the correlation coefficient may underestimate or misrepresent the true strength of the relationship. | Employ techniques such as scatter plots to visualize the relationship and identify non-linear patterns. Consider using alternative methods such as polynomial regression or other non-linear models to capture the non-linearity. |
| Outliers | Extreme values (outliers) can disproportionately influence the correlation coefficient, potentially distorting the results. | Identify and address outliers by examining the data for potential errors or unusual values. Consider robust correlation measures that are less sensitive to outliers, or remove outliers if they are determined to be erroneous. |
| Data Measurement Issues | Errors in data collection or measurement can produce inaccurate or misleading correlations. Errors in data entry, inconsistent measurement scales, or unreliable instruments can affect the validity of the results. | Validate the data collection methods to ensure accuracy and reliability. Use appropriate and consistent measurement scales and procedures throughout the study. Conduct rigorous quality checks on the data to identify and correct errors. |
Concluding Remarks

In conclusion, this guide has explored the power of correlation analysis using the CORREL function. We have covered the theoretical foundations, practical applications, and potential pitfalls of this important statistical tool. By understanding how to use the CORREL function and interpreting correlation coefficients, you can gain valuable insights from your data and make more informed decisions in a variety of contexts.
The detailed examples and visual aids will help solidify your understanding and empower you to apply these techniques effectively in your own work.